
How to Look Up Durham County Jail Population Data
Durham County jail population data lives in a few official places, not one dashboard. The Sheriff's Office publishes annual reports, and the county budget tracks a detention metric each year. For broad context, federal and research data fill the gaps. The Sheriff's detention services page describes the facility and its capacity, while the annual reports index holds the year-by-year detention statistics. A 2024 Annual Report PDF sits in that index.
Reading these sources takes some care. Annual reports tend to update once a year, so the figures lag real time. The Durham County FY 2025-26 budget book tracks the "average daily population of detainees in Durham Detention Center" as a performance metric. That label confirms the county measures daily custody. The exact value, though, was not harvested in the research used for this page. For live custody counts, the Sheriff's inmate population search shows current bookings, but it is a roster tool, not a statistics report.
So the data splits into two kinds. County-specific facts, like bed capacity, come straight from the Sheriff. Rate comparisons and demographic patterns come from national data. Knowing which source a number came from keeps the picture honest.
Durham County Jail Capacity Overview
The Durham County Detention Facility is the county's main adult jail. It opened in the summer of 1996 with 576 single cells and was built as a direct-supervision "New Generation Jail." Over time the county added 160 bunk beds to some cells. That change raised the rated capacity to 736. These are county-specific figures from the Sheriff, and they anchor most Durham County jail population numbers.
The building uses a two-wing layout with 12 housing pods. Each pod has two levels of cells set around a dayroom, with access to outdoor recreation on all three housing levels. Two pods are set up for special supervision. One special 48-bed unit was noted as leased to hold N.C. Department of Corrections prisoners, so the operating count can mix local detainees with a limited number of state holds.
| Capacity Figure | Beds | Source Note |
|---|---|---|
| Original single cells (1996) | 576 | Sheriff detention services history. |
| Capacity after bunk additions | 736 | Sheriff detention services page. |
| Special 48-bed unit | 48 | Noted as leased for N.C. DOC prisoners. |
Capacity is not the same as population. A 736-bed rating sets the upper bound, but the daily count usually runs below it and shifts with arrests, releases, and court action.
Durham County Average Daily Population
Average daily population, or ADP, is the most useful single number for any jail. It smooths out day-to-day swings and shows the typical custody load over a year. Durham County tracks it. The county budget book names "average daily population of detainees in Durham Detention Center" as a metric it follows.
Here is the honest limit. The exact Durham ADP figure was not harvested from the budget PDF or the annual report in the research used here. So no specific county ADP number can be quoted without inventing one, and that is not done on this page. The Sheriff's annual reports and the county budget book are the right places to pull the current value once it is read directly.
What can be said with confidence is the frame. ADP runs against the 736-bed cap, and the county uses programs like work release, electronic house arrest, and pretrial screening that can shift how many people stay in a cell on a given day.
Note: Durham County tracks average daily population as an official budget metric, but the exact value was not harvested for this page, so confirm it in the current Sheriff annual report.
Demographic Breakdown
Demographic data answers who is held in a jail. The usual cuts are gender, race or ethnicity, and age. The Durham Sheriff's annual reports are built to carry this kind of detail, and the build notes flag male and female counts, race and ethnicity, and age ranges as fields to pull from those PDFs.
Durham's exact demographic splits were not harvested in this research pass, so no county percentages are shown below. State and national patterns still give a useful backdrop. The Bureau of Justice Statistics reports that local jails nationwide hold far more men than women and overrepresent Black and Hispanic populations relative to their share of the general public. Those are national patterns from BJS, not Durham figures.
| Demographic Field | Status for Durham |
|---|---|
| Male / female split | Tracked in Sheriff reports; value not harvested. |
| Race / ethnicity | Reported when published; value not harvested. |
| Age ranges | Reported when published; value not harvested. |
The takeaway is simple. The fields exist, the county can report them, but the exact Durham numbers belong in the annual report, not in a guess.
Pretrial vs. Sentenced Population
A county jail is not just for people serving time. Most people in a jail are pretrial, which means they are held while a case is still open and no conviction has been entered. Others are sentenced and serving a short jail term. Some are held for another agency or are waiting to transfer to state prison. Durham's roster mixes all of these.
The two terms matter for any population count. A pretrial detainee can be released by a written promise, an unsecured bond, or a secured bond, and that release can happen any day. A sentenced person stays for a set term. The split between the two groups was not harvested for Durham, but BJS data shows that across the country most local jail residents are pretrial rather than convicted.
Pretrial detainee: a person held while a case is open, before any conviction, often pending bond.
Sentenced detainee: a person convicted and serving a jail term, usually a shorter sentence than state prison time.
Court status and bond detail come from the eCourts Portal, not the jail roster. The roster shows custody; the Durham County court records show how a case is moving.
Misdemeanor vs. Felony Population
Charge level shapes who stays in the jail and for how long. A misdemeanor is a lower-level offense, and a felony is more serious. People held on felony charges tend to face higher bonds and longer holds, so they often make up a large share of the count even when misdemeanor arrests happen more often. Durham's exact charge-level split was not harvested, and the build notes list "most common charge categories" as a field to pull from the annual report.
One Durham detail helps explain the mix. The county's specialty courts route some lower-level, nonviolent cases tied to substance use or mental illness away from jail and into treatment. That diversion can pull certain people out of the daily count.
Felony cases sit in the Superior Court Division, and misdemeanors sit in District Court. Charge data lives in the case file, not the roster.
Mental Health and Medical Population
Jails carry real medical and mental health loads. The Durham facility puts medical and program functions on its lower levels and delivers sick calls and other services into the housing pods when it can. That design reflects how much care a jail population needs day to day.
Durham also runs programs that touch the health side of custody. The list includes STARR, which stands for Substance Abuse and Recidivism Reduction, a Sexual Offender Treatment Group, AA and NA meetings, and classification screening at intake. The county's Mental Health Court Diversion connects people who have serious mental illness to treatment instead of routine case processing, which is one way the system tries to keep that population out of a cell.
The exact share of the Durham population getting mental health or medical care was not harvested. The annual report is the place to find any published service-utilization figure.
Programs like these matter for population work because they aim to cut repeat bookings. Lower recidivism, over time, means fewer people cycling back into the count.
National and State Context
To judge a local jail count, you need a benchmark. The Bureau of Justice Statistics is the federal source for jail data, and its preliminary 2024 release covers local jail trends, conviction status, admissions, and incarceration rates per 100,000 residents. Rate per 100,000 is the standard way to compare places of different sizes, because raw counts favor big counties.
The BJS preliminary 2024 jail data is the right national anchor for Durham comparisons.
You can read the federal numbers on the BJS preliminary 2024 jail data page, shown below.
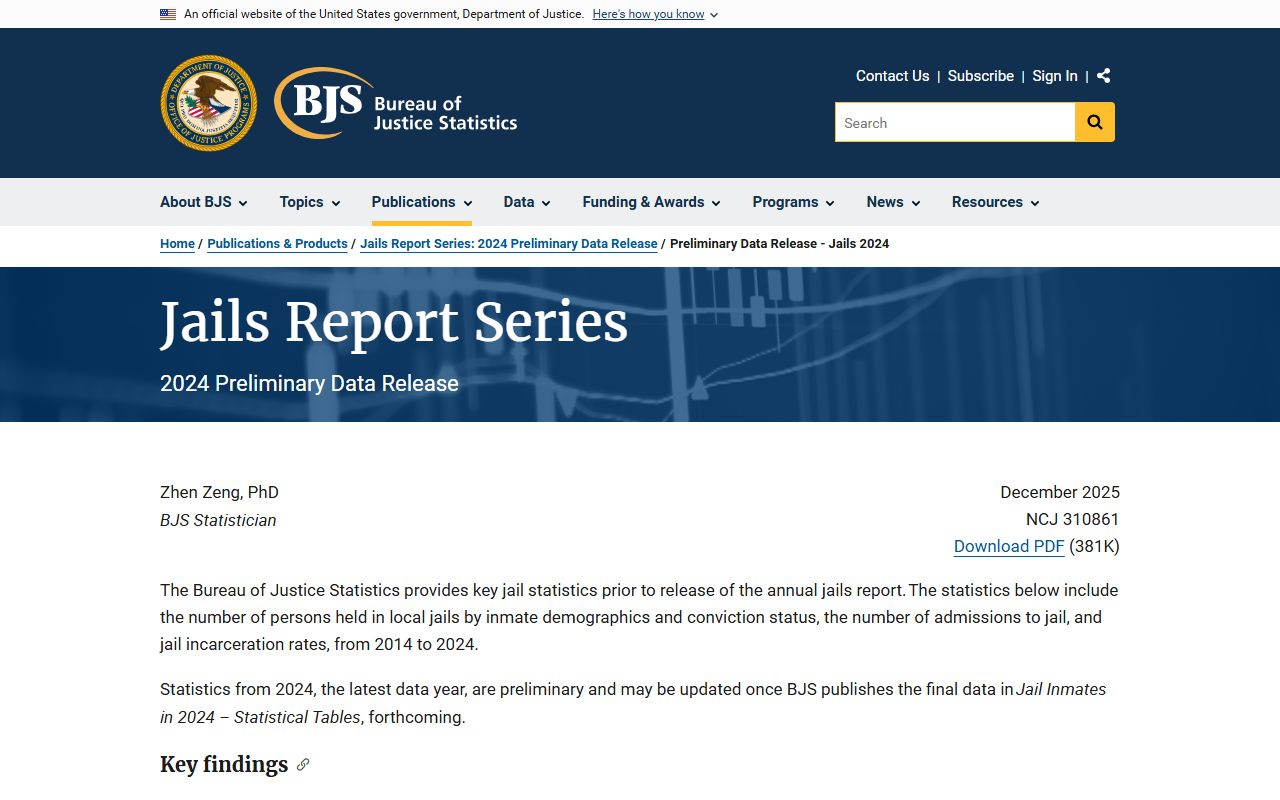
That BJS release sets the national jail incarceration rate that a Durham County figure can be measured against once the local rate is pulled.
For state and county trends, the Vera Institute keeps a North Carolina tool built from BJS and government datasets. It charts jail and prison trends and lets you compare counties, and its case-study material places Durham in the Research Triangle. The table below frames the comparison, with the county rate marked honestly.
| Level | Jail Population per 100k |
|---|---|
| Durham County | Tracked locally; value not harvested. |
| North Carolina | See Vera NC trends tool for the state rate. |
| National | See BJS preliminary 2024 jail data. |
The Vera North Carolina data gives the state and county comparison layer that the federal release does not.
You can open the state view on the Vera North Carolina incarceration trends tool, shown below.
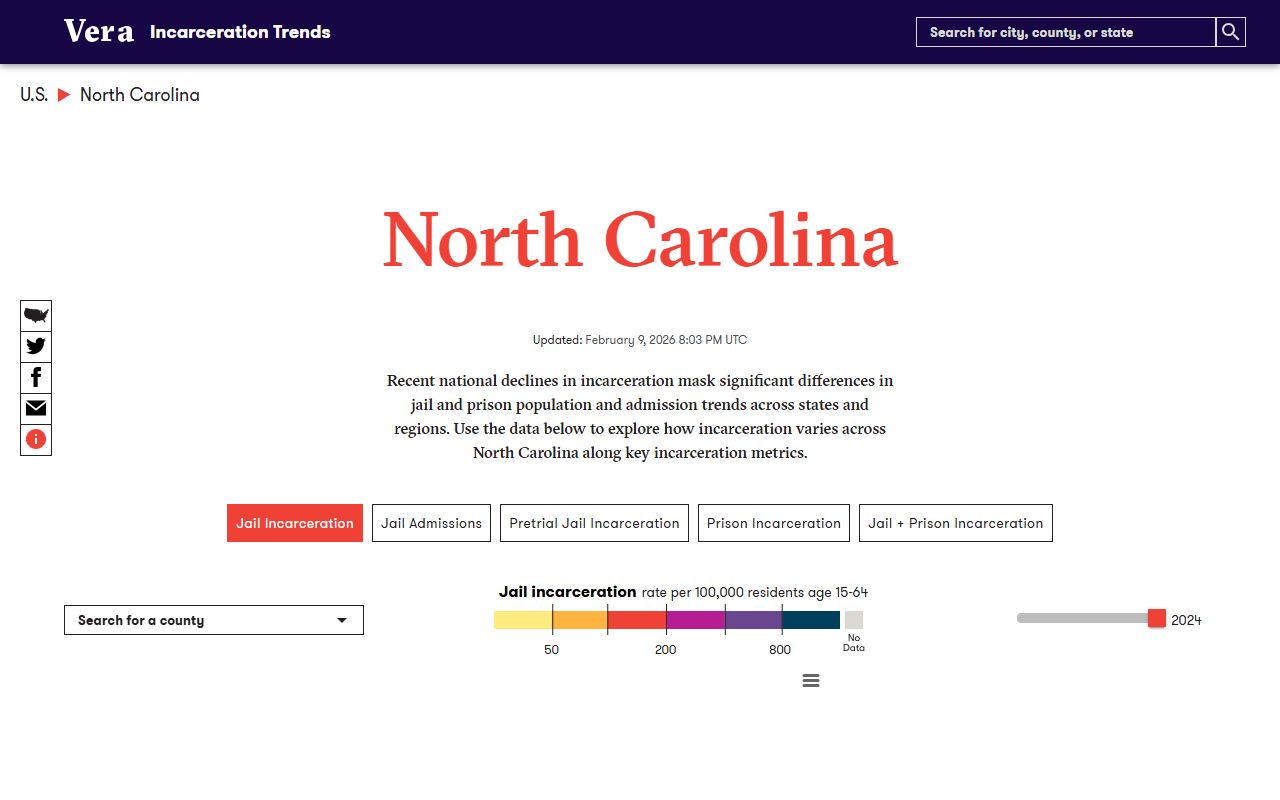
Reading Vera alongside BJS lets you place the Durham jail against both the state and the country once the local rate is in hand.
Population Trends Over Time
Trend data shows whether a jail count is rising, holding, or falling. For Durham, the steadiest fact is the building itself. Capacity has stayed tied to the 736-bed detention facility, and the county's emphasis has shifted toward classification, work release, electronic house arrest, pretrial screening, reentry, and specialty courts. Those tools all bear on how full the jail runs.
A clear five-year ADP line for Durham was not harvested in this research pass, so no multi-year curve is plotted here. Any claim of overcrowding or slack capacity needs the actual yearly ADP first, which the annual reports and budget books hold.
Recent official context is about the building, not the count. In a January 2025 public message, Sheriff Clarence F. Birkhead flagged detention-facility concerns, including a fire suppression failure that required a fire watch, unreliable heating and air conditioning, and camera and door reliability issues. The county budget also lists detention as a tracked cost area. Those are operating and facility-condition points, not population figures, and they should be read that way.
Searching for Durham County Inmate Records by Name
This page covers aggregate jail population data, not individual lookups. To find a specific person in custody by name, use the live jail roster on the Durham County inmate records page, which explains the Sheriff's inmate population search and what each profile shows. For people who have left county custody, the released inmates page covers state and federal release tools.
Where the Data Comes From
Three layers feed Durham County jail population data. The bottom layer is local. Bed capacity, facility design, and yearly detention statistics come from the Durham County Sheriff's Office through its detention services page and its annual reports index. The county budget book adds the average daily population metric and detention cost figures.
The next layer is state and national. BJS supplies the federal jail benchmarks in its preliminary 2024 jail data, and the Vera North Carolina trends tool supplies state and county comparisons drawn from BJS and government datasets. County-specific numbers are labeled as such on this page; state and national numbers are labeled as context.
For the case side of any person in the count, the Durham County arrest records page and the eCourts court files carry charges and dispositions that the roster does not.
The honest rule holds throughout. Where an exact Durham value was not pulled from a source PDF, this page says so rather than guessing.